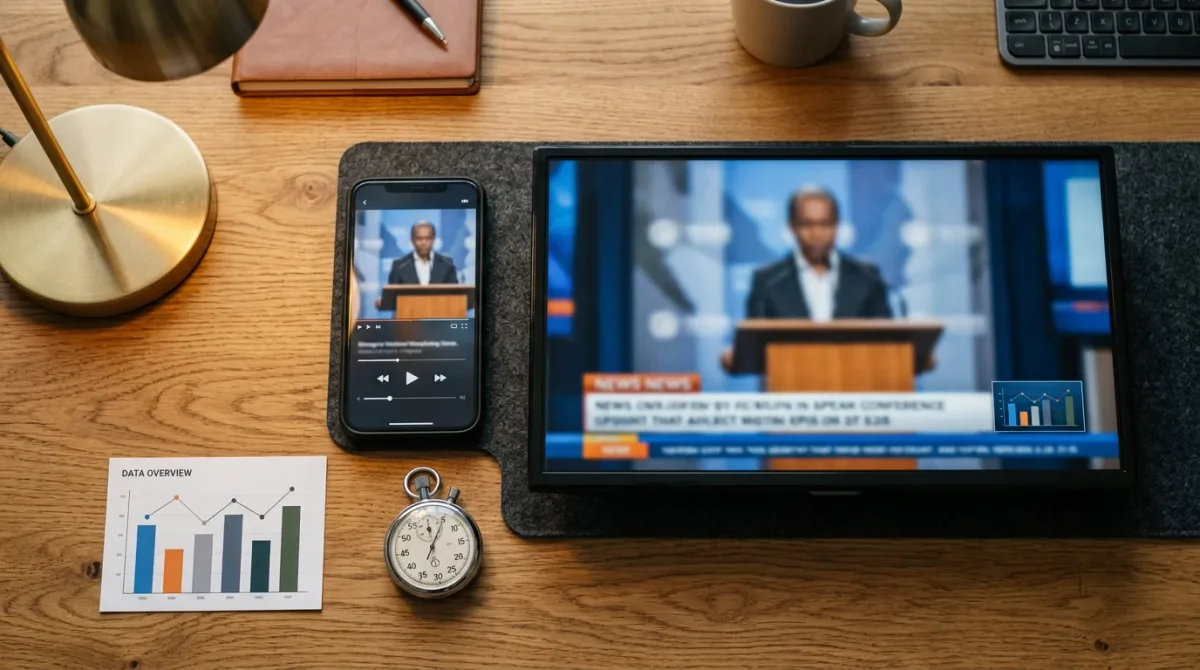
Streaming viewership numbers measure time, not people. Nielsen ranks streaming titles by total minutes viewed by persons 2 and older, and Netflix reports hours viewed, then converts those hours into "views" by dividing by a title's runtime. Neither figure counts how many individual people watched a show from beginning to end.
How does Nielsen decide which titles top the streaming charts?
Nielsen ranks titles by total minutes viewed by persons 2 and older across a single week. The rankings come from Nielsen Streaming Content Ratings, built on the Nielsen National TV Panel and measuring viewing through a television set, according to the methodology notes on Nielsen's Top 10 page.
The charts draw on program-level data from a defined set of services: Amazon Prime Video, Apple TV, Disney+, HBO Max, Hulu, Netflix, Paramount+, Peacock, Pluto TV and Starz. Nielsen adds that the underlying viewing data "are inclusive of streaming viewership to all platforms beyond the listed providers," even though the ranked titles come from those reporting services.
Two things follow from a minutes-based ranking. A returning series with ten episodes stacks up minutes far faster than a two-hour film, so season-length shows tend to sit at the top. And because the panel is anchored to the television set, viewing that happens on a phone during a commute is not the same thing as viewing counted here.
What does Netflix count as a view?
Netflix defines a view as the total time spent watching a movie or season of a series, divided by that title's running time. The company adopted the metric in June 2023, moving on from a ranking based purely on hours viewed, as Rick Porter set out in The Hollywood Reporter.
The definition has moved more than once. Netflix originally counted a view when an account watched 70 percent of a film or of a single episode, then switched to counting two minutes of any title as a view, then adopted hours viewed in the autumn of 2021. Explaining the current version, the company said the views figure "proved to be a more relatable metric for many people" and described its reporting as "anchored in engagement — our best measure of member satisfaction and a key driver of retention," per the same report.
Porter's worked example is the clearest way to see the limits. Extraction 2 recorded 88.4 million hours watched in its first week; divided by a 124-minute runtime, that comes out at roughly 42.8 million views. It does not mean 42.8 million people sat through the film, only that the accumulated hours are equivalent to that many complete run-throughs.
Why do two numbers for the same title disagree?
They are different currencies, and they are counting different things. Nielsen's figure is United States viewing, through a television, estimated from a panel. Netflix's figure is global, spans every device, and comes from the company's own servers. A title can look enormous in one and modest in the other without either being wrong.
Netflix began publishing that server-side data in December 2023, with a report listing hours viewed for every title, original and licensed, watched for more than 50,000 hours. The first edition covered January to June 2023 and spanned more than 18,000 titles and nearly 100 billion hours, which the company said represented 99 percent of all viewing on the service. Runtime and views were added to the report in May 2024 so titles of different lengths could be compared.
The most recent edition, covering January to June 2026, reported more than 97 billion hours viewed and said the company measures engagement "not only by the quantity of hours watched, but also the quality of that experience," according to Netflix's own engagement report. That report also states that starting in the first quarter of 2027, Netflix will move from a six-month to a yearly snapshot.
What is The Gauge, and what does it show?
The Gauge is Nielsen's monthly picture of how U.S. audiences spend their time watching television across platforms and media distributors. It divides total viewing into broadcast, cable, streaming with individual platforms identified, and an "other" bucket that holds unmeasured sources, video on demand, audio streaming, gaming and DVD playback.
Each edition represents a broadcast month and is based on Live+7 viewing for the reporting interval, meaning a program's audience includes playback within seven days. The most recent period published as of this writing is June 2026, reported on a total day, persons 2 and older basis.
The Gauge answers a different question from the Top 10. The Top 10 asks which titles collected the most minutes in a week. The Gauge asks what share of all television time went to streaming at all, which is why it is quoted in coverage of the industry's shift away from traditional distribution rather than in coverage of any single show.
What changed in Nielsen's measurement in 2026?
A methodology adjustment in March 2026 pushed reported streaming numbers down, streaming services objected, and Nielsen delayed its monthly Gauge release. Nielsen then set out a set of fixes taking effect on September 1: correcting a timing lag in the Advertising Research Foundation's Device and Account Sharing survey, which had been running on data roughly 18 months old; counting co-viewing with the help of wearable devices; and improving the weighting behind its combined big data and panel approach.
Nielsen senior vice president Brian Fuhrer framed the work plainly. "Our objective is to make our data more accurate, and that means removing bias, and it means bringing us closer to the truth," he said in comments reported by TheWrap on August 20, 2026. The same report noted that with the September adjustment in place, streaming was expected to remain the largest share of television viewing.
The episode is a useful reminder that measurement is a product, and products get revised. A chart that changes shape from one month to the next has not necessarily recorded a change in what people watched.
What should you take from a streaming chart?
Read the label before the number. Three questions settle almost every confusion: what is being counted, over what window, and in what territory. Minutes viewed in a U.S. week and global views across six months are not comparable, and no honest headline can make them so.
It also helps to remember what these figures were built for. They are trading currencies for an industry that buys and sells attention, not attendance records. A title that lingers near the top of a minutes chart for several weeks is telling you something real about how long people stayed with it, which is often the more interesting story anyway.
For a related entertainment perspective, read Gossip Stone TV to Launch on Major Streaming Platforms with Star-Studded Lineup.