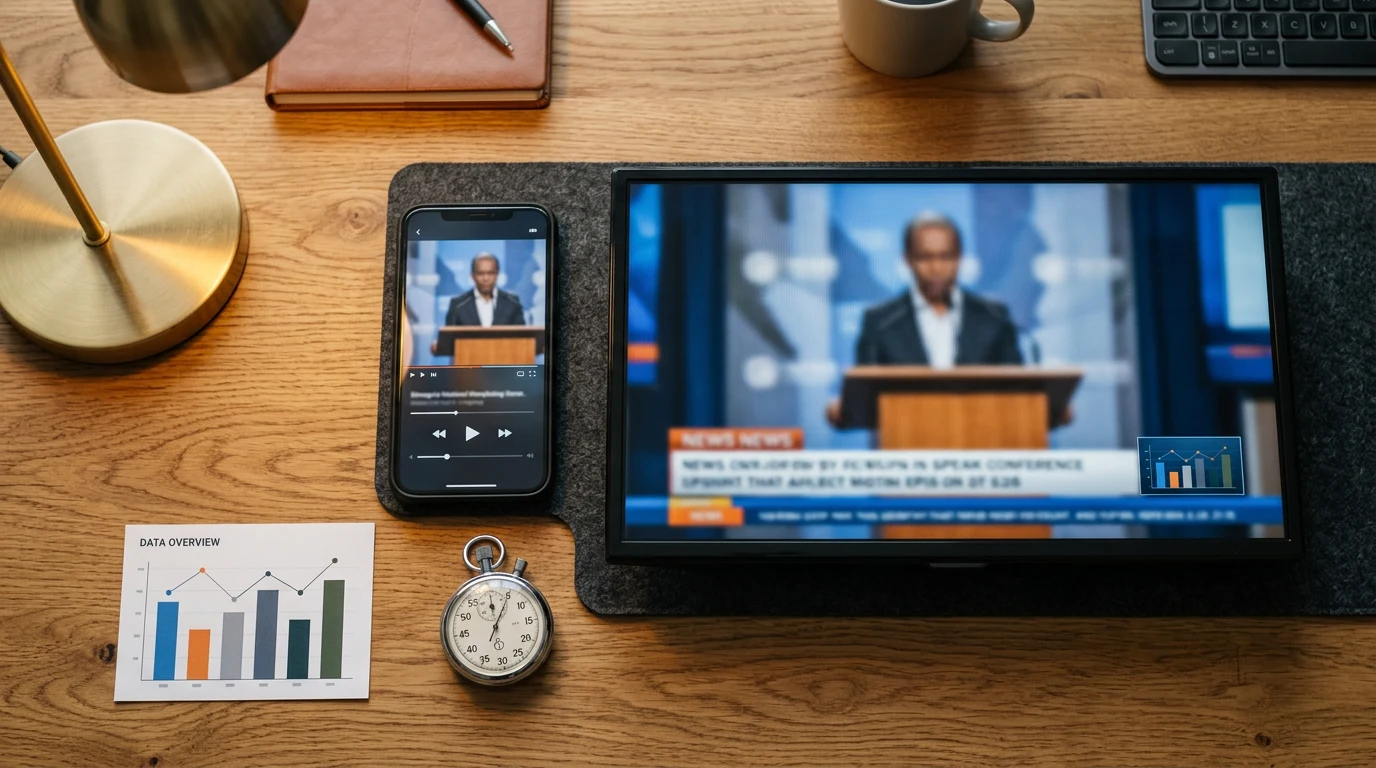
Streaming ratings in the United States come mainly from Nielsen, the century-old measurement firm that launched a dedicated streaming report, The Gauge, in May 2021 and captured the moment in July 2022 when streaming first surpassed cable in total TV viewing. The numbers count minutes watched by a statistical sample of households, then release them monthly. But unlike broadcast, where everyone uses one currency, streaming ratings mix Nielsen's estimates with each platform's self-reported figures, and the two systems answer different questions. Understanding what each number measures explains most disputes about which show is actually winning.
How does Nielsen measure streaming?
Through audio recognition in a panel of thousands of households, matched against the national population. When a panel television plays a title, whether on a smart TV, a console or a stick, Nielsen identifies the program and the service through its watermark and content signature. Minutes watched get aggregated into monthly totals, divided by the number of programs and by population reach. The Gauge then slices all television viewing into streaming, cable and broadcast, which is how the industry knows streaming's overall share of screen time kept climbing through 2025.
What are hours viewed, the platform numbers?
Netflix popularized a second currency in 2021 when it began publishing total hours viewed per title, later refined to views by dividing hours by runtime. The company now releases engagement reports twice a year covering thousands of titles. Other platforms publish selective top-ten lists. The strength of platform data is completeness: they count every play everywhere. The weakness is that each publisher defines success differently, chooses what to release and has every incentive to make its titles look strong. There is no independent audit.
Why don't platforms just share everything?
Competition and history. Ratings existed in broadcast because advertisers needed a common currency to buy commercials. Streaming was subscription-based, so nobody outside the company needed the numbers, and secrecy became leverage in negotiations with talent, whose contracts increasingly include viewership bonuses. As advertising tiers grew after 2022, platforms gradually accepted Nielsen's currency for ad sales, which is why the measurement firm's streaming business expanded while platform self-reporting remained selective.
What do the numbers actually hide?
Several distortions. Runtime inflates total-minutes rankings, so long episodes and long seasons beat tighter shows regardless of popularity. Sampling misses phones and laptops, counting only TV screens. Autoplay inflates hours, since episodes run whether anyone watches. Completion and repeat viewing get bundled together, so comfort rewatching can outscore a smaller show that every subscriber finishes. And global versus domestic totals blur comparisons, because a title can be a worldwide hit while barely registering in the United States.
What is a rating versus a reach?
Rating measures the share of all households or people watching. Reach measures how many distinct viewers touched a title at all, even for a few minutes. A show can have enormous reach and weak engagement, because curiosity sampling counts, or modest reach and intense engagement, as with prestige dramas whose audiences finish every episode. Platforms weigh both when renewing, but public lists usually emphasize the combined-minutes figure, which favors broad sampling over devotion.
How did the measurement change the business?
Enormously. When Netflix began publishing hours viewed in 2021, talent negotiations changed immediately, because writers and actors finally had public numbers to argue with. Nielsen's monthly Gauge reports turned streaming share into a boardroom priority, accelerating spending shifts. The 2023 Hollywood strikes partly concerned transparency of viewing data, and the agreements that ended them included provisions for more disclosure to unions. Measurement stopped being plumbing and became leverage.
Can viewers trust any of it?
As context, not gospel. Nielsen offers independent consistency, so its rankings are comparable month to month. Platform self-reports offer completeness but selective framing. The honest read uses both: a title that leads Nielsen's US TV-screen list and appears in global engagement reports is genuinely big, while a show touted only in a platform press release deserves skepticism about the metric chosen. The numbers are real. The framing is the flexible part.